UK divorce rates are waning. However, divorce is a complex societal issue. Below, you will find data and trends regarding divorce in the UK. From varying divorce rates by age group to living arrangements by ethnic group, you will gain insight into the UK divorce rate.
What is the current UK divorce rate?
The latest UK divorce rate is between 30% and 40%, according to the Office for National Statistics (ONS). Over the past 50 years at least one-third of all marriages in the UK have ended in divorce. However, this broad average doesn’t tell us everything about evolving British divorce trends.
Divorce rate in England and Wales
The most recent Office of National Statistics figures show that there are 8.9 divorces per 1000 married women in the UK. This is the refined divorce rate (RDR) which is based on the number of married women instead of the overall population.
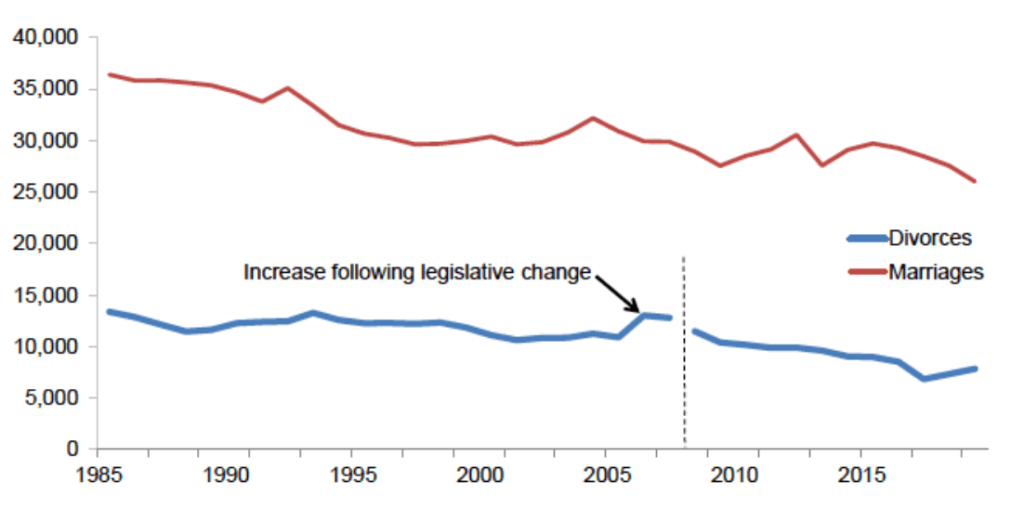
The 2020 divorce totals from the Office of National Statistics show that there were 103,592 divorces per year in England and Wales.
Year-on-year divorce totals have been trending downwards for the past three years with latest figures representing a 4.5% decrease for England and Wales.
Divorce rate in Scotland
Recent figures from the Scottish Government show a 13% decrease over the current recorded period. The latest annual divorce petition total for Scotland, dating back to 2020, stands at just over 9000 petitions for the most recent calendar year.
Scotland has seen a more significant decrease in divorce than other areas of the UK because of a modified Scottish Family Law Act coming into effect and changing the non-cohabitation requirements for divorce petitions.
Divorce rate in Northern Ireland
The most recent crude divorce rate for Northern Ireland is 0.8 per 1000 people. Current annual figures from the Northern Ireland Statistics and Research Agency, dating back to 2020, are 1507 divorces registered against 3724 marriages.
What is the major cause for divorce in the UK?
The major cause for divorce in the UK varies depending on the gender of the spouse petitioning for divorce when considering opposite-sex couples.
- For men, the most widespread reason is a separation of over two years.
- For women, the most cited reason for wanting a divorce is unreasonable behaviour of the spouse.
However, these are not the only reasons for UK divorce proceedings. Here are the other top reasons why UK couples divorce:
- Lack of preparation for married life
- Excessive arguing
- Infidelity
- Lack of equality
Average UK divorce rate by age
The average UK divorce rate varies depending on age group. Recent figures put the highest divorce rate at 13.9 per 1000 for women in their 30s. For men, the highest rate is for those aged between 45 and 49, at 13.8 per 1000.
| Age range | Divorce rate for men | Divorce rate for women |
| Under 20 | 0 per 1000 | 5.2 per 1000 |
| 20 to 24 | 9.4 per 1000 | 11.8 per 1000 |
| 25 to 29 | 13.3 per 1000 | 12.7 per 1000 |
| 30 to 34 | 13 per 1000 | 13.9 per 1000 |
| 35 to 39 | 13.4 per 1000 | 13.9 per 1000 |
| 40 to 44 | 13.6 per 1000 | 13.7 per 1000 |
| 45 to 49 | 13.8 per 1000 | 12.9 per 1000 |
| 50 to 54 | 10.8 per 1000 | 9.3 per 1000 |
| 55 to 59 | 7.8 per 1000 | 5.9 per 1000 |
| 60+ | 2.2 per 1000 | 1.6 per 1000 |
What is happening with marriage and divorce for Britons 65+?
While the 60+ age demographic has one of the lowest rates of divorce rates in the UK, the marriage and divorce trend for older people is clear. There has been a noticeable increase in marriage and divorce for this age group.
The number of newlyweds aged 65 and up has increased by 46% over the past decade. This has led to media outlets such as The Times and The Guardian dubbing these new 65+ couples as silver splicers and silver separators, based on whether participants are starting or ending marriages. It’s currently too early to tell what the impact of this trend will be on the overall UK divorce rate.
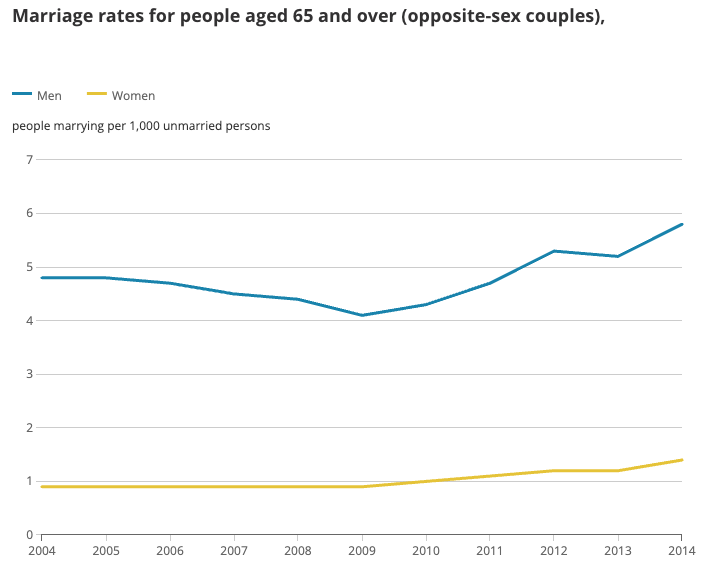
While divorce petitions are on the wane across the UK, older people are not following that trend. According to the ONS, the number of men over 65 seeking divorce increased by 23% over a period of ten years. For women over 65, this increase reaches 38% for the same time period.
These are the main reasons for marriage and divorce being on the rise for Britons over 65:
- Clearer relationship goals and a renewed desire for connection as the primary drivers for this trend, according to the Centre for Research on Ageing and Gender.
- Marriage simplifies pension arrangements for retired couples.
- Married couples are exempt from a 40% inheritance tax for the surviving partner.
Household types by ethnic group: UK breakdown
While UK divorce rate figures are not broken down by ethnic group, there is granular data by household types.
| Household Ethnicity | Cohabiting Couple | Single-parent | Married/Civil Partnership | Single person | Other household type | Pensioner couple |
| Asian | 3.5% | 8.8% | 47% | 17% | 21.7% | 2.1% |
| Black | 6.8% | 24.3% | 21.6% | 31.7% | 14.1% | 1.5% |
| Mixed | 11.2% | 19.1% | 19.9% | 35.2% | 12.9% | 1.7% |
| White | 10.3% | 10.2% | 32.9% | 30.9% | 6.8% | 8.9% |
| Other | 5.2% | 10.5% | 37% | 30.7% | 15% | 1.4% |
Asian households have the largest proportion of married or civil partnership couples as well as the smallest percentage of single-parent or cohabiting households, when compared to other ethnicities.
Black households, on the other hand, have the highest proportion of single-parent households as well as the highest proportion of other household types of living arrangements.
White households make up the biggest segment of pensioner couples, which is in line with both the demographic makeup of the UK and the recent increase in marriage and divorce for Britons 65+.
UK interracial household data
Mixed-ethnicity households are least likely to be composed of married couples while favouring cohabitation. For this reason, the number of divorce petitions is potentially lower for mixed-ethnicity households when compared to other ethnic groups in this breakdown.
Since a significant percentage of mixed households report cohabitation without marriage, the end of a relationship is less likely to be recorded as a divorce.
Average UK divorce rate for couples with children
According to the most recent study by the ONS, only half of marriages ending in divorce are requested by couples who have children. The downward UK divorce rate trend is also reflected for married couples with children.
Data shows that the more children a married couple has, the less likely they are to initiate a divorce petition. Divorce is about ten times more prevalent for married couples with one or two children when compared to couples with three or more children.
The other factor impacting the UK divorce rate for couples with children is the age of the child at the time of the divorce petition. Here is the breakdown of UK children affected by the divorce of their parents by age group.
| Age group of UK children at the time of divorce | Number of UK children affected by divorce |
| 0-4 years old | 19,454 |
| 5-10 years old | 41,461 |
| 11-15 years old | 33,949 |
Children are most likely to experience the divorce of their parents when they are in primary school (ages 5-10). Children of secondary school age (11-15 year olds) are the second largest group impacted by divorce.

Same-sex UK divorce rate
UK divorce data for same-sex couples has not been collected for as long as data for opposite-sex couples. This is due to same-sex marriage being a recent legal and civil rights development in the UK.
It may take decades to collect statistically significant data regarding trends for same-sex couples. The figures presented here cannot yet provide meaningful insights into data about divorce in same-sex couples.
Here are some key facts based on the latest data collected by the Office for National Statistics:
- 6.6% of same-sex marriages have ended in divorce.
- Same-sex divorce represents 1.1% of total UK divorce numbers.
- There were 1154 same-sex divorce petitions this past year.
- Unreasonable behaviour was the most common reason for same-sex couples seeking divorce.
- Over 70% of same-sex divorces are petitioned by same-sex couples where both spouses are female.
- There has been a 40% year-over-year increase in same-sex divorce.
- The average duration of a same-sex marriage is 4.7 years for female couples and 5.4 years for male couples.
The overriding reason for same-sex divorce petitions, ‘unreasonable behaviour’, is the same as for opposite-sex couples petitioning for divorce.
FAQs about divorce rate in the UK
You can find answers to common questions about UK divorce rates below.
What is the divorce rate in the UK?
The current divorce rate in the UK is 8.9 per 1000, according to the UK Office for National Statistics. Over the past half century, a third of all marriages have ended in divorce.
How is the divorce rate calculated?
Divorce rate is calculated by dividing total annual divorces by the yearly average of a specific overall population. For a crude divorce rate (CDR), the population is the total national average or total population mid-year.
For a refined divorce rate (RDR), the annual divorce total is divided by total married women. This method is often preferred since it accounts for age demographics unlike crude divorce rate. However, this method does not accurately represent same-sex divorce trends.
Both divorce rate calculation methods generally express results in the form of the number of divorces per 1000.
Why has the divorce rate increased?
The UK divorce rate has not increased. The overall UK divorce rate trend is a downward one, and has been for the past decade.
Recent ONS data regarding 65+ marriage and divorce does suggest a potential divorce rate increase for older people but it is too early to tell whether it will offset overall decreasing divorce trends.
What has the divorce rate shown about poverty?
Divorce leads to a decrease in personal wealth. The most recent UK Wealth and Asset Survey by the Office for National Statistics shows that divorced households are two to three times more likely to move down an income band after the end of a marriage.
Women bear the brunt of the financial impact after a divorce. On average, a woman´s financial worth post-divorce is half of that of a man´s.
What profession has the highest divorce rate?
According to a recent UK solicitor survey, these are the professions with the highest divorce rates by percentage.
- Dancers and Choreographers
- Massage Therapists
- Bartenders
- Call-centre agents
- Nurses
- Factory workers
- Psychiatrists
- Carers
- Entertainers, musicians, and professional athletes
- Telemarketers
UK divorce rate: final thoughts
While divorce rates are decreasing, the impact of a marriage breaking up on spouses and children is no less significant. The data on this page provides insight into societal and demographic trends of divorce but not the personal consequences or what to do next.
Our guide on what comes after divorce has advice on the steps you can take to help you move forward.